Equivalent fractions have always been a mixed bag of emotions for me. On one hand I get excited and think it is so obvious which fractions are equal, less than, and greater than one another. However, on the other hand I get terrified when I really start to look and compare because there is a lot of obscurity in fractions. There is usually a point where I start to panic and draw pictures to try and compare differences visually.
Here is a great, fast cheat to see if two fractions are equivalent: a/b = c/d if and only if ad = bc
For example 1/2 = 5/10 because 1 x 10 = 10 and 2 x 5 = 10
I love being able to do this because I know that no matter what fractions are thrown at me, I will be able to quickly and easily tell if they are equivalent.
Ok, great, I think we can tackle fractions that are equal... how about fractions that are less than or greater than one another?
I have found that the easiest way to determine which fraction is larger or smaller is to do a little leg work. I think if you do some calculations up front, you can easily compare the fractions in the end. The trick is to turn the fractions into like fractions. This is done by making them share a common denominator.
You have to multiply the top and bottom of each fraction by the denominator of the other fraction. Like this:
1/2 and 3/9 would become 1 x 9 over 2 x 9 = 9/18 and 3 x 2 over 9 x 2 = 6/18
Now that we have a common denominator we can compare the fractions 9/18 and 6/18. 9/18 is slightly larger than 6/18.
I remember when I was first learning about "integers" and I thought the entire concept was extremely overwhelming. I had the hardest time remembering whether or not integers included fractions. To make it very simple: integers are whole, negative, and positive numbers. On a number line they would be represented like this:
When looking at a number line that represents positive and negative numbers, we call a number and it's negative counterpart opposites. For example the numbers -5 and 5 are opposites.
Another detail we should know about integers is that we may be asked to find their absolute value. Written mathematically that would look like this: |8| = 8
The absolute value of a number is simply the distance of a number from zero. So, the absolute value of |8| is 8 because it is 8 places away from zero.
I have always thought that absolute value was an extremely easy concept to grasp. The absolute value of a number is always positive. However, there are sometimes problems out there that intend to trip you up! For example: -|-8| can be tricky if you aren't paying attention. If I didn't look carefully I would immediately say the answer is 8 because absolute value is always positive. This would be a huge mistake! You have to notice and acknowledge the - sign outside of the absolute value symbol. This means that after the absolute value of a number is determined, a - sign is added back making it a negative integer.
Factoring can be frustrating and time consuming when you don't have a plan of action. Not everyone is aware that there is something called divisibility rules that can be referenced when finding factors. But first, wait a minute... what is a factor???
Factors are numbers that can be multiplied together to create another number. Any given number can have multiple factors.
As you can see, depending on the number... it can take a LONG time to determine all of the factors. For example the number: 100. This number clearly has more than 2 factors. One method is to look at all the numbers from 1-10 and decide if they can multiply with another number to equal 100. This process looks like this:
1 x 100 = 100
2 x 50 = 100
4 x 25 = 100
5 x 20 = 100
10 x 10 = 100
Therefore the factors of 100 are: 1, 2, 4, 5, 10, 20, 25, 50, and 100
Here is a video that explains what factoring is and demonstrates how you can use divisibility rules to find factors:
You can search the web to find resources for home or the classroom to use with kids. There are a lot of free worksheets and videos out there at the click of a button. I found a great site that covers factoring and divisibility rules, along with some sites that have packets and worksheets for student use.
Graphs and data tables are very useful mathematical tools for a variety of reasons. I particularly enjoy them because they can tell a story and offer a significant amount of information in a relatively straight forward way. They are also a great way to organize information in order to get a better look at the bigger picture.
A Line Graph isused to track changes over periods of time. A line graph is the preferred choice when the changes are smaller because they are easier to see. You can also use line graphs to compare changes in multiple groups over a period of time.
A Pie Chart is used when you are comparing parts of a whole. There is no way to use them to show changes over time. They are simply a ratio comparison of specific data.
A Bar Graph can be used to compare things between different groups and is the preferred choice when comparing larger changes over time.
When introducing Graphs to students and children it can be useful to also introduce data collection. The best way to understand how to interpret a graph or chart is to learn how to collect and organize the data for one. I have discovered a very efficient way to introduce data collection to a classroom:
Have each student think of something they want to learn about their classmates, for example: Favorite Food.
Next, determine the number of elements you want them to have for the set.
Show students how to make a T-chart or some other efficient chart to collect the data.
Have the students sit in a circle and pass their charts in the same direction. Make sure the students take their time and everyone fills in a chart.
Show the students the options they have for graphs and have them choose their graphs.
Students create their graphs.
Everyone shares and practices reading each others graphs.
We are constantly exposed to graphs and data tables in the every day world. Many times this is at the hands of marketers and advertisers. There is usually an agenda behind the compilation of information being shared with us. It is important that we are able to interpret the information and be able to spot and identify and biases and flaws. This is the biggest reason it is important for students to learn about these concepts. It is very easy to be swayed by a biased/skewed graph!
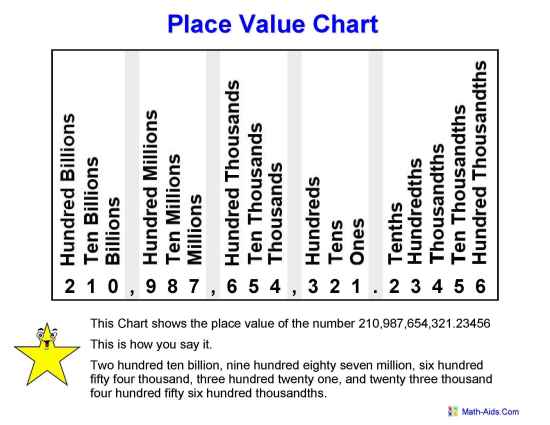
Estimating and computation are huge processes in mathematics. Both require an understanding of the process and ability to recognize appropriate times to use the skill. For my purposes, I will be looking specifically at mental computation, along with estimation in this blog post. Before a person can even begin estimating and working with mental computation, they must understand how place value works. Place Value is the numerical value a digit has because of it's position in a number. Here is a great Place Value reference chart I found at Math-Aids.com:
Place value is especially important when you are trying to estimate. Typically, you are rounding to the nearest whole number for a specific place value. For example, if you were to be told to "round 364 to the nearest ten", you would have to look at the number in the ten spot; in this case 4. When rounding we decide to go up or down based on the value of a specific digit. If the digit is 4 or less we round down, if it is 5 or higher we round up. In the case of 364, the 4 tells us to round down leaving us with 360.
Mental Computation is the process of finding the exact answer to a problem mentally, without any outside supports. Supports are considered paper, pencil, calculator, etc... There are several different techniques for solving with mental computation. Here are several examples:
Count On Technique - Method for adding when one of the addends is 1, 2, or 3. Select the larger addend first, then add by intervals until you have used the second addend. For example: 65+30= 65, 75, 85, 95 Count Back Technique - Like the Count On Technique, this method is best when used with the numbers 1, 2, or 3. Select the larger number first, then subtract by intervals until you have used the second number. For example: 430-3= 430, 429, 428, 427 Choose Compatible Numbers Technique - Look for compatible number patterns that can be solved together easily. Then continue computing like number patterns. For example, numbers that create multiples of 10 or 100. Example: 37+20+243+200= 37+20=57, 243+200=443, 443+57= 500 Break Apart Numbers Technique - Break numbers in computations up into more reasonable easy to work with numbers. For example: 264 can be broken apart to equal 100+100+60+4 Use Compensation Technique - First substitute compatible numbers to make the computation easier to deal with. Then, adjust the answer to compensate for the change you made. For example: 4.99+7.95= 5+8=13 Now compensate for the extra: 13-.06=12.94
Mental Multiplication Math Video (this user has many mental math videos in on his YouTube page)
Computational Estimation is the process of finding an answer that is relatively close to the real answer using a best guess or estimate. Like mental computation, computational estimation has several types of techniques that can be used. Rounding - The process of a number or numbers in a problem with the closest multiple of 10, 100, 1,000, and so on. First find the halfway point between the multiples. Anything below the half way point rounds down while anything above it rounds up. For example: 423 would round down to 420 because the 3 is below 5. 435 would round to 440 because the 5 causes you to round up. Substitution of Compatible Numbers - Replacing some or all of the numbers in a problem with numbers that are easier to compute mentally. For example: 2,479-222 can be replaced by 2,480-220. Front-end estimation - Use the left most digit and pretend all the other digits to the right are zeros. For example: 718-309 can be replaced with 700-300. Front-end estimation - Use the left most digit and pretend all the other digits to the right are zeros. For example:
718-309 can be replaced with 700-300. Clustering - In some addition problems, the numbers cluster around a common number. Find the common number and multiply by the number of addends. For example: 24, 31, 37, 28 can all be compared to 30. So, we would turn this into 30 X 4.
Examples of Front End, Clustering, and Compatible Numbers:
Sets
in Mathematics have always been confusing to me when looked at in depth. On the surface, I understand that a set
is grouping or collection of some sort that has identifiable characteristics. However, I struggle answering questions about
sets when they are filled with Set Theory jargon. For example, when I see the symbols: ∩ and ∪, I often get them mixed up in my mind. I have now memorized ∪ (union) because it is clearly a U shape, hence union. This helps me remember ∩ must then mean Intersecting. A Union is a when you take multiple sets and list all the elements in each set combined. When you are considering the Intersection of multiple sets, you are looking for the common elements.
When
I read about sets I realize that they are not as elusive as I once thought and
I am capable of analyzing them. I can
often be a concrete thinker and it is beneficial to me to have definitions and
examples as I work on math. Therefore I
have decided to find quick resources that I can study to familiarize myself
with Set
Theory language and meaning. With
practice, I believe I will eventually learn the process of identifying and
comparing characteristics of sets.
All this talk about sets and I suppose you are wondering what a set looks like! An example would be this set: {a, b, c, d, e, f, g} A second example would be: {e, f, g, h, i, j, k}. So what does the union of these two sets look like? It's really quite simple, take all the letters in each set and list them like this: {a, b, c, d, e, f, g, h, i, j, k}. How about the intersection of the sets? Again, quite simple! However, evaluate and compare each set carefully so you don't miss a shared element: {e, f, g}.
When considering mathematics for children, the concept of sets should be introduced as early as possible. The level of complexity and detail can be adjusted to the level of the child. You can introduce the concept by using objects rather than numbers and variables. Use something fun and familiar like M&M's!
Kids can make piles of different combinations of m&m colors and take an inventory of what the combined number of colors are and what colors each set has in common.
You can use your imagination and come up with any assortment of objects that is familiar to your student or child. Some other ideas are different clothing objects, sports equipment, money, toys, etc.
Here is another example using the sports equipment idea:
Set one {baseball, basketball, football}
Set two {football, catchers mitt, softball}
To make it more interactive you can use the actual items, kids love when they can use props! An add on lesson would be to branch out into data collection. How many baseballs total, how many footballs total, etc?
Check out this awesomely narrated video introducing Set Theory:
Some additional resources:
Quick
reference guide to Set Theory symbols can be found here
Set Theory in depth descriptions can be found here